Monday, August 18, 2014

PDC_WATCHDOG_TIMEOUT (14f) debugging

I received a PDC_WATCHDOG_TIMEOUT (14f) crash dump, although I seemed to have misplaced the source. What a shame! Anyway, this bug check is pretty mysterious. There's very little to no documentation on it, and not too many have had it occur on their systems to show up in any sort of web search. With that said, let's do our best to get some info on it!

 PDC_WATCHDOG_TIMEOUT (14f)  
 A system component failed to respond within the allocated time period,  
 preventing the system from exiting connected standby.  
 Arguments:  
 Arg1: 0000000000000002, Client ID of the hung component.  
 Arg2: 0000000000000002, A resiliency client failed to respond.  
 Arg3: fffff801867d3578, Pointer to the resiliency client (pdc!_PDC_RESILIENCY_CLIENT).  
 Arg4: ffffd001b7f61b30, Pointer to a pdc!PDC_14F_TRIAGE structure.  

We can see right away that the cause of the bug check itself is:
A system component failed to respond within the allocated time period, preventing the system from exiting connected standby.
With that said, now is a good time to discuss connected standby. Connected standby is a low-power state (implemented in Windows 8, also in 8.1) that features extremely low power consumption while maintaining a constant internet connection. Here is how to trigger connected standby:

  • Press the system power button.
  • Close the lid or tablet cover, or close the tablet into an attached dock.
  • Select Sleep from the Power button on the Settings charm

The best comparison is a smartphone's power button. When you press the power button on one of today's smartphones, it will transition to a similar state as opposed to entirely shutting down. This way, when you press the power button again, it will start right back up from where you previously left off.

Now that we know how to trigger the connected standby, how does it wake up and transition to its active state again?

  • Press the system power button.
  • Open the lid on a clamshell form-factor system.
  • Open the tablet if it is connected to a portable dock with a keyboard (similar to a lid in a clamshell system).
  • Generate input on an integrated or attached keyboard, mouse, or touchpad.
  • Press the Windows button that is integrated into the system display.

Other than user-related actions, system components, programs, etc, can wake the system from connected standby as well. For example, if the user has an incoming Skype call, the system will immediately awake and create a 25 second time frame to answer the call. If it is not answered, the call is canceled and the system will go back into connected standby.

System components or devices can also wake the core silicon or SoC from connected standby, even though those events may not turn on the display. Nearly all devices connected to a connected standby system are expected to be capable of waking the SoC from its deepest idle power state.

--------------------

Now that we understand connected standby, we now understand that for some reason a specific system component failed to respond during the set time period, therefore the system remained in connected standby when it should have woken up.

First of all, what kind of device is this given the fact that we likely wouldn't see connected standby on a desktop (or maybe even a laptop)?

 0: kd> !sysinfo machineid  
 Machine ID Information [From Smbios 2.8, DMIVersion 39, Size=1106]  
 BiosMajorRelease = 3  
 BiosMinorRelease = 7  
 FirmwareMajorRelease = 32  
 FirmwareMinorRelease = 0  
 BiosVendor = American Megatrends Inc.  
 BiosVersion = 3.07.0150  
 BiosReleaseDate = 05/15/2014  
 SystemManufacturer = Microsoft Corporation  
 SystemProductName = Surface Pro 3  
 SystemFamily = Surface  
 SystemVersion = 1  
 SystemSKU = Surface_Pro_3  
 BaseBoardManufacturer = Microsoft Corporation  
 BaseBoardProduct = Surface Pro 3  
 BaseBoardVersion = 1  

Ah, it's a Surface tablet! It all makes sense now.

As this was a minidump, our call stack was extremely uninformative:

 0: kd> k  
 Child-SP     RetAddr      Call Site  
 ffffd001`b7f61af8 fffff801`867dcd72 nt!KeBugCheckEx  
 ffffd001`b7f61b00 fffff803`712daadb pdc!PdcpResiliencyWatchdog+0xa6  
 ffffd001`b7f61b50 fffff803`71356794 nt!ExpWorkerThread+0x293  
 ffffd001`b7f61c00 fffff803`713e15c6 nt!PspSystemThreadStartup+0x58  
 ffffd001`b7f61c60 00000000`00000000 nt!KiStartSystemThread+0x16  

We can see we're starting a thread which turns out to be a worker thread, and then we call into pdc!PdcpResiliencyWatchdog+0xa6. This implies we failed to complete the resiliency phase in the allotted time period (however long). Usually when you see resiliency phase issues on a device regarding anything in terms of waking from an inactive state (sleep, hibernate, etc), the first thing to look at is network. For example, the D0 IRP for the required network device may not have completed in time due to a 3rd party conflict, etc.

We can further confirm we're likely dealing with a network issue by taking a look at our bucket_id:

 FAILURE_BUCKET_ID: 0x14F_WCM_pdc!PdcpResiliencyWatchdog  

WCM is the Windows Connection Manager, which enables the creation and configuration of connection manager software.

As this is a Surface Tablet, one can imagine it's likely using WiFi. If a Wi-Fi connection is available, the system will wait for the Wi-Fi device only, regardless of whether a mobile broadband (MBB) connection is available. With this said, I took a look at what loaded modules we had to see if any antivirus was installed, firewall, etc. I was essentially looking for anything that could have accidentally interfered with the network upon wake.

Here's what I found:

 0: kd> lmvm MBAMSwissArmy  
 start       end         module name  
 fffff801`8851d000 fffff801`8853e000  MBAMSwissArmy  (deferred)         
   Image path: \??\C:\windows\system32\drivers\MBAMSwissArmy.sys  
   Image name: MBAMSwissArmy.sys  
   Timestamp:    Thu Mar 20 18:12:35 2014  

Malwarebytes Anti-malware driver, listed and loaded.

I asked the user to uninstall Malwarebytes for temporary troubleshooting purposes, and the crashes no longer occurred. I hope the user also contacted Malwarebytes support to work out any possible issues that need to be patched.

I hope to see more of these bug checks in the future, and hopefully with a kernel-dump next time as well so I can go in-depth!

Thanks for reading!

Wednesday, August 13, 2014

Double Fault

I was recently sent a pretty neat kernel-dump by my good friend Jared. I've always wanted to go into double faults, so let's get started! Thanks, Jared : )

 UNEXPECTED_KERNEL_MODE_TRAP (7f)  
 This means a trap occurred in kernel mode, and it's a trap of a kind  
 that the kernel isn't allowed to have/catch (bound trap) or that  
 is always instant death (double fault).  
 Arguments:  
 Arg1: 0000000000000008, EXCEPTION_DOUBLE_FAULT  
 Arg2: 0000000080050033  
 Arg3: 00000000000406f8  
 Arg4: fffff800032aa875  

In our case, the 1st argument was 8, therefore this indicates a double fault occurred. So, what is a double fault, and when/why does one occur?

Double faults occur when an exception cannot be handled by the handler, or when an exception occurs when the CPU is already trying to call an exception handler for a previously thrown exception. In most cases, two exceptions that were thrown at the exact same time are handled separately, however in some cases, you may have a situation occur in which a pagefault occurs, but the exception handler is located in a not-present page, two page faults would occur and neither of them can be handled. This is known as a double fault! Also, double faults can occur (like in this scenario) when the processor cannot properly service an interrupt that is pending.

 4: kd> k  
 Child-SP     RetAddr      Call Site  
 fffff880`009b9de8 fffff800`0328b169 nt!KeBugCheckEx  
 fffff880`009b9df0 fffff800`03289632 nt!KiBugCheckDispatch+0x69  
 fffff880`009b9f30 fffff800`032aa875 nt!KiDoubleFaultAbort+0xb2  <- Uh oh, double fault!
 fffff880`03dccfd0 fffff800`032909ba nt!KiIpiSendRequest+0x305  <- As it is a multiprocessor job, processor #4 sent an inter-processor interrupt to interrupt another processor saying "Hey, we need to flush the TLB."
 fffff880`03dcd090 fffff800`032ec198 nt!KeFlushMultipleRangeTb+0x22a  <- Flushing translation lookaside buffer, this is a multiprocessor job.
 fffff880`03dcd160 fffff800`033935ea nt! ?? ::FNODOBFM::`string'+0x204ce  
 fffff880`03dcd350 fffff800`03394be7 nt!MiEmptyWorkingSet+0x24a  <- Removing as many pages as possible from the working set.
 fffff880`03dcd400 fffff800`0372f371 nt!MiTrimAllSystemPagableMemory+0x218  <- Unmapping all pageable system memory.
 fffff880`03dcd460 fffff800`0372f4cf nt!MmVerifierTrimMemory+0xf1  
 fffff880`03dcd490 fffff800`0372fc24 nt!ViKeRaiseIrqlSanityChecks+0xcf  <- As verifier is enabled, it's doing a sanity check. A sanity check is essentially verifier saying "Okay, what IRQL are we on and are we supposed to be here?"
 fffff880`03dcd4d0 fffff880`018443f5 nt!VerifierKeAcquireSpinLockRaiseToDpc+0x54  <- IRST resetting IRQL to DISPATCH (2) and then acquiring a lock.
 fffff880`03dcd530 fffff880`018222a2 iaStor+0x253f5  <- Intel Rapid Storage Technology
 fffff880`03dcd560 fffff880`01871489 iaStor+0x32a2  <- Intel Rapid Storage Technology

 4: kd> ub nt!KiIpiSendRequest+0x305  
 nt!KiIpiSendRequest+0x2eb:  
 fffff800`032aa85b 5e       pop   rsi  
 fffff800`032aa85c 5d       pop   rbp  
 fffff800`032aa85d c3       ret  
 fffff800`032aa85e 8bc6      mov   eax,esi  
 fffff800`032aa860 e9e2feffff   jmp   nt!KiIpiSendRequest+0x1d7 (fffff800`032aa747)  
 fffff800`032aa865 0fb70db4892100 movzx  ecx,word ptr [nt!KeActiveProcessors (fffff800`034c3220)]  
 fffff800`032aa86c 0fb705af892100 movzx  eax,word ptr [nt!KeActiveProcessors+0x2 (fffff800`034c3222)]  
 fffff800`032aa873 8bfa      mov   edi,edx  

By unassmembling nt!KiIpiSendRequest+0x305 backwards, it looks like there's a check for active processors, and then the attempt to send the IPI.

 4: kd> !ipi  
 IPI State for Processor 0  
   TargetCount     0 PacketBarrier    0 IpiFrozen   2 [Frozen]  
 IPI State for Processor 1  
   TargetCount     0 PacketBarrier    0 IpiFrozen   2 [Frozen]  
 IPI State for Processor 2  
   TargetCount     0 PacketBarrier    0 IpiFrozen   2 [Frozen]  
 IPI State for Processor 3  
   TargetCount     0 PacketBarrier    0 IpiFrozen   2 [Frozen]  
 IPI State for Processor 4  
   TargetCount     0 PacketBarrier    0 IpiFrozen   0 [Running]  
 IPI State for Processor 5  
   TargetCount     0 PacketBarrier    0 IpiFrozen   2 [Frozen]  
 IPI State for Processor 6  
   TargetCount     0 PacketBarrier    0 IpiFrozen   2 [Frozen]  
 IPI State for Processor 7  
   TargetCount     0 PacketBarrier    0 IpiFrozen   2 [Frozen]  

By running !ipi we can check the inter-processor interrupt state for every processor on the box. We can see here that every single processor (except #4) is in a frozen state (idle), therefore obviously our IPI is never going to be serviced, will remain pending, and we're going to double fault.

 4: kd> lmvm iaStor  
 start       end         module name  
 fffff880`0181f000 fffff880`01bc3000  iaStor   (no symbols)        
   Loaded symbol image file: iaStor.sys  
   Image path: \SystemRoot\system32\DRIVERS\iaStor.sys  
   Image name: iaStor.sys  
   Timestamp:    Wed Feb 01 19:15:24 2012  

The IRST driver is dated from early 2012, which is likely the problem since it is a notoriously problematic driver, and it gets worse as it gets older. The newer update would likely solve it, but honestly, I always usually recommend a user safely removes and replaces this driver with the standard MSFT driver if they aren't running a RAID setup. Kaspersky was also present on this system, and antivirus suites don't tend to play nice with this software either.

This post also shows how helpful Driver Verifier is, and how without it in this specific scenario, we likely would have had no idea what was causing this, and may interpret it as a hardware problem.

Thanks for reading!

Saturday, August 9, 2014

MEMORY_CORRUPTION_STRIDE

You know when you have something you really want to write a blog post about, but you don't have a crash dump for it? Debugger problems. Fortunately enough for me, I searched Google for a live crash dump link and found one. Happy days! Thanks to this person from four or so years ago for their crash dump :~)

Let's take a look at our basic bug check information in this case. This time, let's use code boxes. I never use code boxes on my blog, but now it's time!

 SYSTEM_SERVICE_EXCEPTION (3b)  
 An exception happened while executing a system service routine.  
 Arguments:  
 Arg1: 00000000c0000005, Exception code that caused the bugcheck  
 Arg2: fffff80002cc272d, Address of the instruction which caused the bugcheck  
 Arg3: fffff8800a555070, Address of the context record for the exception that caused the bugcheck  
 Arg4: 0000000000000000, zero.  

As with most 0x3B's, our exception was specifically an access violation.

 2: kd> ln fffff80002cc272d  
 (fffff800`02cc2590)  nt!KiDpcInterrupt+0x19d  | (fffff800`02cc2780)  nt!KiDpcInterruptBypass  

The violation in this case specifically occurred in nt!KiDpcInterrupt+0x19d.

 2: kd> .cxr 0xfffff8800a555070;r  
 rax=0000000000000001 rbx=fffffa8006b24b60 rcx=0000000000000000  
 rdx=000001af00000000 rsi=0000000000000000 rdi=0000000000000003  
 rip=fffff80002cc272d rsp=fffff8800a555a50 rbp=fffff8800a555ad0  
  r8=0000000000000000 r9=0000000000000001 r10=0000000000000000  
 r11=0000000000000064 r12=0000000000000000 r13=0000000000000000  
 r14=0000000000000064 r15=000007ff00042020  
 iopl=0     nv up di pl zr na po nc  
 cs=0010 ss=0018 ds=002b es=002b fs=0053 gs=002b       efl=00010046  
 nt!KiDpcInterrupt+0x19d:  
 fffff800`02cc272d 0fae1f     stmxcsr dword ptr [rdi] ds:002b:00000000`00000003=????????  

On the instruction we faulted on, we failed storing the contents of the MXCSR register within rdi (0000000000000003). We can certainly imagine 00000000`00000003 is completely invalid, so therein lies our problem.

So, why are we hitting a pagefault within a DPC interrupt? Good question! Let's run the following:

 !chkimg -lo 50 -db -v !nt  

!chkimg compares an image with its original copy. More specifically, it does this by comparing the image of an executable file in memory to the copy of the file that resides on a symbol store.

The -lo 50 parameter limits the number of output lines to 50. Not too much and not too little.

The -db parameter displays mismatched areas in a format that is similar to the db debugger command. Therefore, each display line shows the address of the first byte in the line, followed by up to 16 hexadecimal byte values. The byte values are immediately followed by the corresponding ASCII values. All nonprintable characters, such as carriage returns and line feeds, are displayed as periods (.). The mismatched bytes are marked by an asterisk (*).

The -v parameter displays extra verbose information.

!nt is the module, which is of course the kernel.

 2: kd> !chkimg -lo 50 -db -v !nt  
 Searching for module with expression: !nt  
 Will apply relocation fixups to file used for comparison  
 Will ignore NOP/LOCK errors  
 Will ignore patched instructions  
 Image specific ignores will be applied  
 Comparison image path: c:\localsymbols\ntkrnlmp.exe\4A5BC6005dd000\ntkrnlmp.exe  
 No range specified  

Above we can see that as I noted above, it's comparing the kernel image from the crash dump to the latest symbol stored on my local symbol cache. If it wasn't available locally, it'd grab it from the symbol server.

 Scanning section:  .text  
 Size: 1685025  
 Range to scan: fffff80002c06000-fffff80002da1621  
 Total bytes compared: 1685025(100%)  
 Number of errors: 40  

So we have 40 errors specifically in the .text section of the kernel that was scanned.

 fffff80002cc2680 19 b9 01 00 00 00 44 *44 22 c1 fb e8 80 17 f9 *48 ......DD"......H  
 fffff80002cc2690 fa b9 00 00 00 00 44 *45 22 c1 65 48 8b 0c 25 *34 ......DE".eH..%4  
 fffff80002cc26a0 01 00 00 f7 01 00 00 *25 40 74 25 f6 41 02 02 *85 .......%@t%.A...  
 fffff80002cc26b0 0e e8 8a 68 05 00 65 *8b 8b 0c 25 88 01 00 00 *48 ...h..e...%....H  
 ...  
 fffff80002cc2700 8b 55 d8 4c 8b 4d d0 *ba 8b 45 c8 48 8b 55 c0 *00 .U.L.M...E.H.U..  
 fffff80002cc2710 8b 4d b8 48 8b 45 b0 *07 8b e5 48 8b ad d8 00 *89 .M.H.E....H.....  
 fffff80002cc2720 00 48 81 c4 e8 00 00 *ff 0f 01 f8 48 cf 0f ae *1f .H.........H....  
 fffff80002cc2730 ac 0f 28 45 f0 0f 28 *4c 00 0f 28 55 10 0f 28 *40 ..(E..(L..(U..(@  
 ...  
 fffff80002cc2880 24 10 48 89 74 24 18 *38 89 64 24 20 48 8b f9 *00 $.H.t$.8.d$ H...  
 fffff80002cc2890 8b d1 49 8b f0 4c 8b *15 49 83 e9 11 48 83 ea *01 ..I..L..I...H...  
 fffff80002cc28a0 4c 8b da 48 8b ef bb *8b 00 00 00 49 3b f1 0f *48 L..H.......I;..H  
 fffff80002cc28b0 c1 05 00 00 49 3b fb *48 83 b8 05 00 00 8a 06 *e8 ....I;.H........  
 ...  
 fffff80002cc2900 a8 20 0f 85 e6 03 00 *90 8a 56 06 88 57 05 a8 *44 . .......V..W..D  
 fffff80002cc2910 0f 85 69 04 00 00 8a *41 07 88 57 06 a8 80 0f *ec ..i....A..W.....  
 fffff80002cc2920 db 04 00 00 8a 56 08 *f9 57 07 48 83 c6 09 48 *ba .....V..W.H...H.  
 fffff80002cc2930 c7 08 e9 74 ff ff ff *24 3b fd 0f 87 b8 00 00 *05 ...t...$;.......  
 ...  
 fffff80002cc2980 f3 a4 49 8b f4 48 83 *8b 01 a8 02 0f 85 81 00 *83 ..I..H..........  
 fffff80002cc2990 00 8a 56 02 88 57 01 *49 04 0f 85 40 01 00 00 *f2 ..V..W.I...@....  
 fffff80002cc29a0 56 03 88 57 02 a8 08 *3a 85 f1 01 00 00 8a 56 *48 V..W...:......VH  
 fffff80002cc29b0 88 57 03 a8 10 0f 85 *00 02 00 00 8a 56 05 88 *8b .W..........V...  

Assuming I am correct (which I hopefully am), every 8th and 16th bit of each byte are no good (as if it's striding through the data). This is known as a stride corruption pattern.

 MEMORY_CORRUPTOR: STRIDE  

It's a characteristic of address line issues that occur somewhere between going in/out of RAM. Despite the display evidence thus far, we cannot jump to a faulty RAM conclusion as much as we'd like to. Perhaps we'd like to assume that the selector which controls these lines is faulty, so any byte stored in these lines is going to have invalid 8th and 16th bits. This would mean faulty RAM, however, in debugging we must always be sure to check everything before doing something such as outright replacing the RAM, even though we could defend and say that a Memtest would be just fine as well.

A similar memory corruption pattern is misaligned IP (instruction pointer). Not going into that in this blog post, but it's also another one you need to be 100% sure is not a simple buffer overflow as opposed to faulty RAM. Do note that WinDbg is not smarter than we are and assumes that a misaligned IP is a hardware problem.

Enough blabbering, onto what I am trying to get to...

 PROCESS_NAME: MOM.exe  

MOM.exe, what are you doing here? By the way, MOM.exe is AMD/ATI's Catalyst Control Center (CCC) monitoring software. It's not malware, or an actual mother.

</badjoke>

You normally don't see this process involved with a crash too often, and with this said, I did some digging in the modules list to see if any 3rd party software may have caused conflicts.

 2: kd> lmvm rtcore64  
 start       end         module name  
 fffff880`0859b000 fffff880`085a1000  RTCore64  (deferred)         
   Image path: \??\C:\Program Files (x86)\MSI Afterburner\RTCore64.sys  
   Image name: RTCore64.sys  
   Timestamp:    Wed May 25 02:39:12 2005  

Oh my... MSI AB driver from 2005 on an x64 Windows 7 box! The horror.

So, today's lesson summed up is - If you're going to actually use MSI Afterburner (the horror), be sure to keep it up to date so you don't upset mother <\badjoke> and make her crash by causing stride corruption.

Thanks for reading!

Saturday, July 26, 2014

Customizing the WinDbg environment

Hi everyone,

In this post, I am going to discuss some of the customizations that I have come across in reading and videos from those such as Andrew Richards, etc, that I always make to my WinDbg environment to make it that much more comfortable/easier in the long run. In this post, I am using a fresh install of Windows 7 x64 on a VM so I can explain better and truly start from scratch. Do note that all of the customizations I make here also follow on Windows 8, etc, as well.

Disclaimer: This post will not teach you/show you how to install WinDbg! There are already plenty of posts and tutorials out there regarding that. This is strictly regarding its customization once it is installed.

Registering File Associations

On clean install of WinDbg with zero modifications and/or customizations done, this is what crash dumps look like:


We can see that the kernel-dump in the picture has no icon, etc, and is just a file. This is due to the fact that it has no known association. If we attempt to double click the crash dump in this state, Windows throw an error and say "Hey, we have no idea what type of file this is, so can you please perhaps tell us what program you'd like to associate all future crash dumps with?"

To properly circumvent this and set the file association, we're going to want to open an elevated command prompt. You can quickly do this by pressing Windows Key + R to open the run box, and then typing cmd and pressing Ctrl+Shift+Enter to execute an elevated command prompt.

Now that we have a window open, let's sidetrack to discuss something. If you navigate to the location in which you installed your WinDbg, and go into the Debuggers folder, we see the following:


We have an x86 and x64 debugger, and this is due to the fact that it's always best to debug a crash dump in its original architectural environment. With this said, if you're debugging a crash dump generated by an x64 box, you'll want to use the x64 debugger. At least 90% of all crash dumps you'll be debugging at this time in our life will be x64, therefore we want to obviously associate the x64 debugger as the main program for crash dumps. It just makes sense.

Now that we have navigated to the Debuggers folder, we can register associations by quickly going one folder higher (x64) and typing the following:

windbg -IA

Typing the above will do the following:


-- YOU MAY NEED TO RESTART AFTERWARDS TO HAVE IT FULLY APPLY.

Great! Now all future crash dumps are associated with the x64 debugger. This raises one problem though, what if we're assisting a user and they are on an x86 box? Surely we can just navigate to the WinDbg directory, go to the x86 folder and open the debugger, but this is too much work.

With the above said, let's have some fun by pressing the Windows Key + R to open the run box, and then typing regedit to execute the Registry Editor. The key we're interested in working within is HKEY_CLASSES_ROOT. It's important to note that this is the key that controls all of the file name extension associations and COM class registration information. With that said, programs start how they're supposed to thanks to this key!

Now we want to take a peek at the extension .dmp (scroll down until you see it, or actually type .dmp until you get there):


The above is essentially a shortcut which implies in the default key, jump to WinDbg.DumpFile.1.

Now that we know this, let's go ahead and do as we did above, but instead type windbg until we get to WinDbg.DumpFile.1. You can alternatively scroll as well if you're cautious of screwing anything up, although it'll take you awhile:


WinDbg.DumpFile.1 is where the .dmp extension is housed.

If we click DefaultIcon:


The familiar little computer WinDbg icon is what resource -3002 is from windbg.exe.

If we go into shell, we see Open:


If we double-click the string itself:


&Open actually creates the underscore under the O in the Open command in the context menu for right-clicking a crash dump. We want to change this from &Open to Open x&64, for example:


and then click OK.

Now that we've done this, as said above, on the context menu for crash dumps, instead of saying Open, it will say Open x64. For example:


Great! We're making progress, but we also want an Open x86 option on the context menu as well. In order to do this, bring regedit back up and right-click shell, select new, and then select key. Once you've done this, name the new key Open_x86. After we've done all that, this is what regedit should look like:


With all of the above done, now we need to go ahead and set that value by double-clicking where it says (Default), and typing Open x&86 this time as opposed to Open x&64 as we did earlier above. Now we need to right-click our Open_x86 key, select new, and then select key. Once you've done this, name the new key command. After we've done all that, this is what regedit should look like:


Once we have the above, to save ourselves some time, let's navigate to Open's command key, double-click (Default), and then copy the string's Value data. For example:


With the above Value data copied, let's navigate back to our created Open_x86's command key, double-click (Default), and then paste into Value data's empty box. DO NOT PRESS OK YET!

We need to make an adjustment to the path, which is extremely simple.

Here was my pasted Value data:

"C:\Program Files (x86)\Windows Kits\8.1\Debuggers\x64\windbg.exe" -z "%1"

Here is what it needed to be changed to:

"C:\Program Files (x86)\Windows Kits\8.1\Debuggers\x86\windbg.exe" -z "%1"

Extremely simple as I noted, and all I had to do was change x64 to x86.

With all of the above said and done, now if we once again right-click a crash dump to bring up its context menu, here's what we now see:


Fantastic, so now we no longer need to spend time traversing through folders and such to open the x86 debugger if we need to. You may be saying to yourself "This was a bit of a pain, I really don't want to do this every time I have to reinstall Windows...". You're in luck, you don't have to!

If you now right-click WinDbg.DumpFile.1 in regedit, select Export, and save it as WinDbg_IA.reg, you're now exporting that registry key from the registry to be saved. This is extremely handy because you can throw it on your trusty USB that you use for absolutely everything debugging related, and when you're on a brand new system/different system that doesn't have file associations set that you need to debug, you can just quickly install the key, and you're good to go. This also of course saves you from having to do this process on your own system.

-- Do note that you will have to do the windbg -IA command before installing the registry key or it will not work. Once you've done the windbg -IA command, you can then simply install the registry key and all the work is done.

Symbols

So now that we have file associations registered for crash dumps, and have successfully modified our crash dump context menu to contain an option to either execute the x64 or x86 debugger, let's go one step further and automate the creation, download, etc, of symbols.

One thing to note is that everything we're doing here in this post could be done manually, but will take twice the actual effort, and will in the end waste time. When we're debugging, etc, and looking to get a box back up and running that we're debugging on, time is of the essence. With that said, all of these steps are to make our lives as debuggers much easier.

First off, it's important to understand what symbols are! Symbols (also known as PDB files -- program database) hold a variety of data which are not actually needed when running the binaries, but contain very useful debugging information. The fact that they are not needed when running the binaries themselves is the reason why PDB files exist! PDB files exist to separate the symbols from the binary, which ultimately helps limit the size of the executable, saving disk storage space and reducing the time it takes to load the data.

Symbol files contain:
  • Global varibles
  • Local Variables
  • Function names and the addresses of their entry points
  • Frame pointer omission (FPO) records
  • Source-line numbers
Each of these items is individually a symbol. For example, a single symbol file called Myprogram.pdb might contain several hundred symbols, including global variables and function names and hundreds of local variables.

Unfortunately, as debuggers who aren't internally within a company (Microsoft for example), we are only provided with what is known as public symbols (as opposed to private). The differences are listed here.

With all of the above said, if a debugger attempts to load a crash dump without symbols, we won't be able to successfully resolve functions, etc, and it'll instead be junk. This is why symbols are very important to have. Normally, when you first install WinDbg, you'd have to navigate to File>Symbol File Path and manually set the path. However, since time is of the essence and we love to do things automatically, we're going to make a one-time script that will set everything for us.

Let's get to work!

1. Create a next .txt file on your Desktop.

2. Within the new .txt file, paste the following code:
md c:\Symbols
md c:\Symbols\Src
md c:\Symbols\Sym
md c:\Symbols\SymCache
setx /M _NT_SOURCE_PATH SRV*C:\Symbols\Src
setx /M _NT_SYMBOL_PATH SRV*C:\Symbols\Sym*http://msdl.microsoft.com/download/symbols
setx /M _NT_SYMCACHE_PATH C:\Symbols\SymCache
You can change Symbols to whatever you want. I just find naming it Symbols is easy to remember and obvious on what's being stored there.

So, what is this script doing?

- Creating the Symbols directory in C:\.

- Inside of the Symbols directory, it's also creating three subfolders: Src, Sym, SymCache.

Src - Source code.

Sym - Symbol path.

SymCache - Symbol cache.

This ultimately creates an environment variable which sets it all for us, therefore we have to do nothing manually.

To expand a little, the reason we're using * in the script is to essentially say:

"Hey, look at C:\Symbols for the symbols. Are they there?"

If the answer is yes, then the symbols are loaded locally.

If the answer is no, then here's what it instead says:

"Hey, look at C:\Symbols for the symbols. Are they there? Oh wow, they're not?! Okay, let's grab them from http://msdl.microsoft.com/download/symbols instead!"

This is done that in the event your local symbols aren't available for some reason, it'll download them from the MSFT symbol server.

3. After pasting the code and changing anything about it to your liking (such as the directory name itself), navigate to File>Save As, change the Save as type: to All Files, and finally give it the File name: Symbols.bat or Symbols.cmd, etc.

4. Once you've done that, run it.

5. After it runs, you're all done setting up symbols and never have to worry about them ever again.

Extensions

Extensions are a really brilliant part of WinDbg that I actually didn't use for awhile, but once I looked into them more, it really has made my life a lot easier. First off, one of the extensions I really can't live without now even using it for such a short period of time is SwishDbgExt.

Some of its features, etc, are listed on that page, as well as the download link. Once you've downloaded it, installing it is really easy. When you extract it, it has a few items, but only two folders you're interested in (x64 and x86). Inside both of these folders is the extension itself, but for its specific architecture.

Now that you know the existence of the extension files, do the following:

1. Navigate to your WinDbg directory. For example, mine is C:\Program Files (x86)\Windows Kits\8.1\Debuggers

2. Once inside the Debuggers folder, double-click the x64 folder, and then the winext folder.

3. Now that you're in the winext folder, this is where you will simply drag n' drop the extension itself from the x64 extension folder. Once you've done that, you're all done for x64. Do the same for x86.

4. Now that you have both the extension files in their respectable directories, load up a crash dump as an example and type !load swishdbgext to load the extension. For example:


Once it's loaded, you can then use any of the various commands that this extension holds. For example, we could run !ms_drivers to display a list of drivers loaded:


We can get in-depth IRP information this way on a driver, such as myfault.sys:


Workspace


Here's what you can get your workspace to look like with some time and some messing around. This was done based off of Tess Ferrandez's workspace. I personally prefer the all stock white/black WinDbg, but if The Matrix is your thing, go for it.

You can make all of these edits by opening up WinDbg on its own and not with a dump file, navigating to View>Options, and changing the Colors how you want. You can also change Fonts through the View menu. Ensure that after you get yours all set, you manually save your workspace by going to File>Save Workspace As..., and then creating one. This will save your workspace and make it the default for the future.

That's it for now, thanks for reading!

References/LinksPimp up your debugger: Creating a custom workspace for windbg debugging.
Channel9.

Wednesday, July 16, 2014

Page Faults Explained

Hello everyone!

In this post, I'm going to do my best to go in-depth regarding page faults, but do my best to speak English at the same time. There are many page fault related articles out there, but I've noticed they're either picking up from an imaginary somewhere (i.e a rushed explanation that seems to begin and end abruptly), incomplete, assume you're already knowledgeable (even basic) regarding Windows' memory manager, paging, page faults, etc. Recently, thanks very much to Pavel Yosifovich, I have a better understanding of page faults and would like to as always share my knowledge as a whole.

-- I would like to note that in the making of this post, as far as double-checking to ensure I was correct goes, if I was not flat out correct, I was either incorrect or learned way more than I thought I knew. This is one of the things I love most about making blog posts, and learning in general.

--------------------

First off, before even diving into page faults themselves, and especially since we want to do this the right way, we need to understand a few things (well, many things).

Disclaimer: I am not going to go extremely in-depth regarding Windows' memory manager (as that would take forever and a half/my knowledge is solely my knowledge), and if you are interested in that, Mark Russinovich has done a brilliant article over at TechNet, as well as many others all across the web if you do some digging (or check the reference links below). I am merely laying the groundwork for the understanding and explanation of page faults and nothing more.

If you ask me personally, Windows' memory manager (and memory management in general throughout the operating system) is one of the most complicated and in-depth parts of Windows internals. It's daunting yet extremely fascinating at the same time, as one extremely in-depth piece leads to another. It seems endless, and I highly recommend spending time reading into the memory management specifics throughout Windows, as it's truly fascinating.

Physical Memory

Physical memory is by far one of the most important resources, and one we must absolutely understand. Among many things, the memory manager within Windows is responsible for the data of all current active processes, drivers, and the operating system. Even today as of this blog post, the operating system itself accesses more code/data than can actually fit in physical memory. With this said, as said by the brilliant Mark Russinovich, think of physical memory as a window into the code/data used over time.

Now that this is known, we can understand that the amount of physical memory present on the system affects performance greatly, because if the data/code needed for a process or the operating system itself is not directly available in physical memory, it must be brought in (paged-in) from the disk which is quite the performance hit.

One of the reasons it's very important to understand physical memory before virtual memory (or in general) is because physical memory contributes to the virtual memory system limit, which interestingly enough is roughly the size of physical memory plus any page files configured on the operating system.

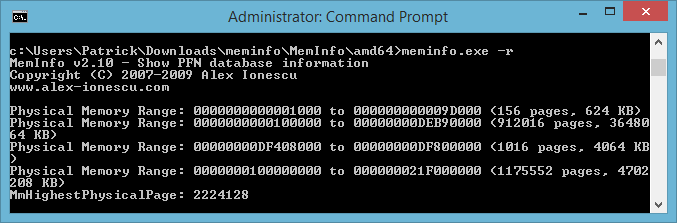
We can view the layout of physical memory with Meminfo (download here). Do note that you'll need to execute the program through an elevated command prompt manually. You can see the path I chose in the screenshot below, as well as the layout itself.


If you use meminfo.exe it will display the different parameters you can use. In our case, if we use meminfo.exe -r it will run Meminfo and display the valid physical memory ranges that are detected.

If you're interested in going further regarding physical memory consumption device-wise, you can use Device Manager to check what addresses devices are occupying. The image below is a simple snippet of my personal system's memory consumption as an example.


We can also take a look at the physical memory limits of Windows 7 and 8 as an example.


As we can see, the actual physical memory limits themselves on the client operating systems drastically increase regarding its x64 architecture, yet remain the same with x86. x86's physical limit has remained 4 GB since Windows XP as far as its client operating systems go. This is simply due to the fact that on x86 systems, the processor's address bus which is 32 lines (and/or 32 bits) can only access addresses ranges 0x00000000 to 0xFFFFFFFF (totaling 4 GB).

--------------------

Virtual Memory

Now that we understand some of the fundamentals behind physical memory, we can go ahead and discuss virtual memory. Do you have your cup of coffee? Good, you're going to need it. It's very important to first understand that virtual memory is a completely different entity than physical memory, although they both work together hand-in-hand.

An extremely important thing to note at this point is a process does not equal (=/=) and/or mean the same thing as a program, and the same follows regarding a thread. For example, when and if you hear a user say "My Firefox (32 bit) process is running according to Task Manger", that's actually not correct. Processes do not run, threads run. Processes are solely a set of resources used to execute a program, and consist of a private virtual address space (where memory is allocated), an executable used to start the application (.exe), a table of handles to various kernel objects, a security context (otherwise known as access token), and one (or possibly more) threads that execute the code.

With all of the above said, virtual memory (of many things, at least) is a technique of Windows' memory manager that maps memory addresses used by a program, namely virtual addresses, into physical addresses. In layman's terms, virtual memory exists to separate a program's view of physical memory, so the operating system can then go ahead and decide whether to store that program's code/data physically and/or virtually.

Let's break this down further! When you run a program, it will go ahead and generate addresses which are generated in the following ways:

  • Load instruction
  • Store instruction
  • Fetching an instruction

Absolutely phenomenal article here regarding the first two. In short, the first two create data addresses, and the third goes ahead and creates instruction addresses. It's very important to know that RAM cannot distinguish between the two, and simply sees them as addresses. Addresses generated by programs are considered virtual, therefore it needs to be translated to a physical address. How does this happen? Good question! This all occurs through address translation hardware (done by the CPU and invoked by the kernel), known as MMU.

After MMU translates virtual > physical, the operating system can then go ahead and create a virtual address space that allows programs to reference more memory than actually physically available by using disk. This is one of the main benefits regarding virtual memory, aside from memory protection.


Thanks to Mike from BrokenThorn for the above image!

All of the above now finally leads into paging and page faults, which will be discussed below.

--------------------

Paging

Paging is very important in many ways, mainly because it allows the operating system to virtualize memory without worrying about segmentation. Instead of splitting up an address space into three logical segments, it's split up into fixed-size units known as a page.

-- A page is a sequence of N bytes where N is a power of 2.

Page sizes are at least 4 K and at most 64 K or more.

--------------------

Page Table/Disk Map

Now that we understand pages/paging, every address space on the system has two things associated with it:

1. Page Table - Identifies which/what pages are in physical memory.

2. Disk Map - Identifies where all the pages are on the disk.

Both of these describe an entire address space.

In an effort to make my own content this time as opposed to using pre-created images (inspired by P.J. Denning and Steve Coile), I have created the image below.


Regarding the above image, the followings flags are:

P - Presence flag

U - Used flag

M - Modified flag

F - Page frame

A - Disk address

With the above now known, if the P flag is set, this implies that the page is currently in physical memory (RAM). The F flag determines its location in memory, and is the number of the page frame in which the page is located.

If however the P flag is not set (not in physical memory), the address mapper will throw a page fault if the process in question attempts to reference the page. If this occurs, the page fault handler will use the disk map to go ahead and locate the page on the disk, and finally swap it (or page it) in. This is only a very minor explanation of a page fault process, and I will expand on page faults below.

--------------------

Page Fault

Finally! We get to the page fault, what we've been waiting for. I described above a very basic page fault process, but it's a lot cooler/interesting than that! In its basic definition of course, a page fault occurs when a program attempts to access pages that are not currently in physical memory (RAM). This is also known as a hard fault. It's absolutely imperative you understand the difference between hard fault and soft fault, which I will discuss below.

Hard Fault - Hard Fault (otherwise known/referred to as a major fault) is the exact same thing as Page Fault, and you'll see its name in Resource Monitor on newer versions of Windows (afaik Vista and later). To expand on why hard faults are defined as they are, and to stress on why they're expensive, it's due to the process the page fault handler must follow if one occurs. For example, if the page is not loaded into memory at the time of a program referencing its address, the page fault handler needs to find a 'free location'. This free location is either a page in memory, or a non-free page in memory.
 
If the latter is currently in use by a pre-existing process, the operating system needs to spend time writing out the data in that current page, and mark it as not being loaded into memory. Once this is done, it is now a free location and can be used to read the data for the new page into memory, add an entry to its location within the MMU, and finally of course indicate that it is now successfully loaded into memory.

Below is an image representation of the entire process outlined above.


Soft Fault - Entirely different from a hard fault, a soft fault is when the MMU (as we discussed above) has not yet marked a page being loaded in memory. This is sometimes/also referred to as a minor fault, as the solution is simple (i.e make the operating system create an entry for the page, have the MMU point to that page in memory, and finally of course indicate that it is now successfully loaded into memory).

With all of this said, you can imagine why page faults/hard faults are an extremely expensive process. It's also imperative that you also understand that having to unnecessarily access the disk is very slow. If anyone has ever had a system in which it was experiencing multiple/frequent page faults for whatever reason, they can truly attest to how much their system slows to a crawl.

Why is this? Well, since you now understand what actually occurs during a page fault behind the scenes, we can imagine how ridiculously taxing this is on the disk. It doesn't help that the process of actually accessing the disk itself is slow in general, but to have to constantly do it is very bad. This is a good time to discuss the main pros & cons of virtual memory (i.e the disk). It's more like pro & con, really.

Pros - Very easy to get a lot of disk space for a small cost.

Cons - Slow!

A processor's register can be accessed in about a nanosecond, cache in 5 nanoseconds, and RAM in approximately 100 nanoseconds. With this said, the disk is literally seconds slower (at least a million times slower). If you are constantly/frequently having to go through the process of a page fault, you can truly imagine yourself now how slow it is.

--------------------

Page Fault - Continued

To go a bit more behind the scenes in regards to page faults, what actually happens when a page fault occurs is the thread that was running is placed into a wait state until the operating system's page fault handler can go ahead and go through the page fault process outlined above. This is done through an interrupt that halts (remember, wait state) the current program.
 
The instruction that went ahead and attempted to either access the page that was invalid, or nonresident (i.e not in physical memory), fails and throws an exception that generates the interrupt discussed above. Before discussing anything any further, we must first discuss why an exception is thrown. Quite simply, an exception is thrown because the CPU has no idea what page files are, etc, and only knows how to work with memory.
 
At this point, one of two things happens:
 
1. An Interrupt Service Routine (ISR) determines that the address is in fact valid, however is not resident (not in physical memory). The operating system then goes ahead and throws an exception (page fault) and goes through the page fault process outlined above. Once the page fault process is successfully completed, the program picks up right where it left off like nothing happened.
 
or
 
2.  An Interrupt Service Routine (ISR) determines that the address is in fact invalid, and then throws an exception known as an access violation. Remember above how we discussed hard (major)/soft (minor) faults? This is specifically known as an invalid fault. In this case, as opposed to following the page fault process outlined above, it is told to not attempt to access the memory as it's a null/bad address, and to simply terminate the executing program in question.

With the above said, this may dispel the common misconception of saying 'frequent page faults are okay'. Frequent page faults are not okay, but that is not to say that page faults aren't a normal operation of the operating system. On a fully functioning machine (regarding both hardware and software), you will experience page faults on a very small scale due to some programs simply requiring more memory (an example). If you are experiencing a very large number of page faults occurring (hard faults/sec), you have a problem, and you can most certainly tell because your system is likely slowed to that of a snail.

As far as some of the potential issues go when it comes to frequent page faults on a system:
 
  • Insufficient RAM (physical memory).
  • Faulty RAM.
  • Need to tailor the pagefile to your system's specific needs.
  • etc

--------------------

Page Fault - BSOD

Now that we understand what happens when a page fault occurs in user-mode, it's also imperative we understand what happens when an exception such as an access violation is thrown in kernel-mode. As you may or may not be able to tell with the way I started this, when a page fault exception such as an access violation occurs in kernel-mode, this results in a bug check (Blue Screen of Death, BSOD).
 
Why? Well, remember we discussed that when an access violation for example occurs, the page fault handler goes ahead and terminates the program. What if we're in kernel-mode and the instruction involving the violation is a device driver? "Uh oh" is exactly what happens. Luckily I have a crash dump from just the other day!
 
SYSTEM_THREAD_EXCEPTION_NOT_HANDLED_M (1000007e)

This indicates that a system thread generated an exception which the error handler did not catch.

BugCheck 1000007E, {ffffffffc0000005, fffff88004a5d62a, fffff880035af908, fffff880035af160}

The 1st argument is the exception code that wasn't handled by the error handler. In this cause, ffffffffc0000005 is an NTSTATUS code. Kernel-mode drivers use NTSTATUS types for return values. ffffffffc0000005's NTSTATUS value is 0xc0000005 (otherwise known as an access violation).

Using NTSTATUS Values

The 2nd argument is the memory address in which the exception occurred at. In our case, this was fffff88004a5d62a.
 
The 3rd argument is actual exception record address. In our case, this was fffff880035af908 which we can run .exr on to show exception record information.
1: kd> .exr 0xfffff880035af908
ExceptionAddress: fffff88004a5d62a (igdkmd64+0x000000000003862a)
   ExceptionCode: c0000005 (Access violation)
  ExceptionFlags: 00000000
NumberParameters: 2
   Parameter[0]: 0000000000000000
   Parameter[1]: 0000000000073070
Attempt to read from address 0000000000073070
Just by looking at the attempted address read, we can assume it's not a null address (because it's not zero), so it must be simply invalid. You can if interested confirm this by running !pte address which will display the page table entry (PTE) and page directory entry (PDE) for the specified address. This is not a kernel-dump, so running it in my case wouldn't yield any beneficial results.

The 4th argument is the context record address. In our case, this was fffff880035af160 which we can run .cxr on to show the context record.
1: kd> .cxr 0xfffff880035af160
rax=0000000000073000 rbx=fffffa8006299040 rcx=fffffa800637d540
rdx=00000000008dfaf0 rsi=fffffa800637d540 rdi=fffff88004a5d3c0
rip=fffff88004a5d62a rsp=fffff880035afb40 rbp=fffffa8006356b20
 r8=0000000000000000  r9=0000000000000000 r10=0000000000000018
r11=fffff880035afb60 r12=fffffa8006356b20 r13=fffffa800661cc30
r14=0000000000000038 r15=fffff88000f15fe0
iopl=0         nv up ei pl nz na po nc
cs=0010  ss=0018  ds=002b  es=002b  fs=0053  gs=002b             efl=00210206
igdkmd64+0x3862a:
fffff880`04a5d62a ff5070          call    qword ptr [rax+70h] ds:002b:00000000`00073070=????????????????
This shows us the context that was saved from the exception at the time of the crash. It contains the CPU registers, the instruction we failed on, the bad address, etc. First off, as highlighted in blue, the exception (access violation) was thrown by/occurred because of igdkmd64.sys (Intel Graphics driver) referencing invalid memory. Regarding the instruction we failed on, we were calling a pointer in the rax register. The rax register in our case was 0000000000073000 (invalid). All of this invalid memory stuff occurring would result in a memory write to ????????????????, therefore the box bug checked.

We can see it from another perspective by disassembling the rip register:
1: kd> u @rip
igdkmd64+0x3862a:
fffff880`04a5d62a ff5070          call    qword ptr [rax+70h]
fffff880`04a5d62d 488b442420      mov     rax,qword ptr [rsp+20h]
fffff880`04a5d632 8b8034010000    mov     eax,dword ptr [rax+134h]
fffff880`04a5d638 c1e813          shr     eax,13h
fffff880`04a5d63b 83e001          and     eax,1
fffff880`04a5d63e 85c0            test    eax,eax
fffff880`04a5d640 0f84ab000000    je      igdkmd64+0x386f1 (fffff880`04a5d6f1)
fffff880`04a5d646 488b442478      mov     rax,qword ptr [rsp+78h]
--------------------

And that's that! I really hope you enjoyed reading, and I imagine there will be many edits/additions to be made as time goes by. For now though, at this moment, I am happy with it.

References/Links

- Pavel Yosifovich's Windows Internals 1/2.
- The Basics of Page Faults.
- Windows Memory Management (Written by: Pankaj Garg).
- Pushing the Limits of Windows: Physical/Virtual Memory.
- So What Is A Page Fault?
- HP OpenVMS Systems Documentation.
- Virtual Address Space and Physical Storage.
- Everything You Need To Know To Start Programming 64-Bit Windows Systems.
- Virtual Memory.
- Physical Memory Structures.
- How to virtualize memory without segments.
- Load/Store Instructions.
- Operating Systems Development - Virtual Memory (by Mike, 2008).
- Implementation of swapping in virtual memory.
- Page fault handling (image).